1.1 How fast do tectonic plates move?
*The contents may be subject to change without prior notice.
K. Z. Nanjo and K. Oike
NaDiR, Global Center for Asian and Regional Research, University of Shizuoka
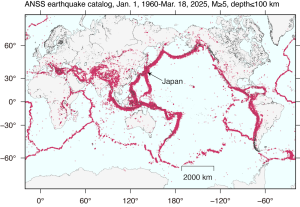
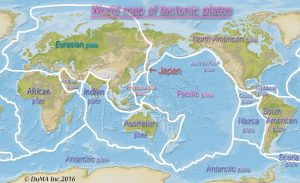
When you mark the epicenters of earthquakes on a world map using dots, you will find that these dots form lines (Fig. 1-1) along the boundaries of tectonic plates. There are about a dozen tectonic plates covering the Earth (Fig. 1-2), and they collide (a “convergent” plate boundary (1)), spread apart (a “divergent” plate boundary (1)), or slide past one another (a “transform” plate boundary (1)) . Tectonic plates are solid sheets of rock that cover the Earth’s surface. The Japanese Archipelago is located at the boundaries of tectonic plates, and thus is at high risk of earthquakes. The energy released by earthquakes occurring near Japan accounts for some 20% of the world’s total seismic energy, and yet the country covers only 0.25% of the world’s total land area, so Japan is considered an earthquake-prone country.

Fig. 1-1: World map of earthquake epicenters. The red dots represent epicenters of earthquakes with magnitude 5 or higher that occurred at depths of less than 100 km between 1960 and 2025. The ANSS Comprehensive Earthquake Catalog that contains earthquake source parameters was used to create this figure.

Fig. 1-2: World map of tectonic plates. The white lines represent the boundaries of tectonic plates. The original of this figure was created by DUMA Inc., and words and/or phrases appeared in it were translated into English.
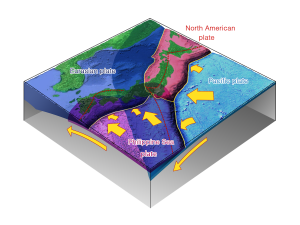
In the vicinity of Japan, the Pacific and Philippine Sea oceanic plates are being subducted beneath the North American and Eurasian continental plates at the rate of a few centimeters per year (Fig. 1-3), which is about the rate at which our hair and nails grow. The tectonic plates are moving so slowly that we cannot directly sense their movement, but this is sufficient to deform the Earth’s surface within several tens or hundreds of years and eventually cause large amounts of energy to be released in the form of seismic waves (earthquakes).

Fig. 1-3: Tectonic plates near Japan. The yellow lines are plate boundaries, the yellow arrows are the directions of plate movements, and the red dotted lines are volcanic fronts (3). This figure was based on the Japan Meteorological Agency (JMA) homepage (4). The original of this figure was created by DUMA Inc., and words and/or phrases appeared in it were translated into English.
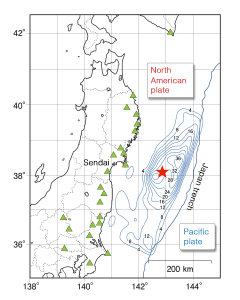
Most earthquakes are small. There are more than 100,000 small earthquakes in Japan each year, but large earthquakes occur only rarely. The largest earthquake observed in Japan since the Japan Meteorological Agency (JMA) started seismic monitoring was the 2011 off the Pacific Coast of Tohoku Earthquake (5) (2011 Tohoku earthquake) whose magnitude, the size of the earthquake, is 9. An earthquake of this magnitude is rare, occurring only once every few centuries or 1,000 years. The ground shaking, the vibration of the ground during the earthquake, were recorded by seismographs (6) all over Japan, and analysis of the data showed that slippage had occurred between the North American and Pacific plates over an area measuring 500 kilometers south-north and 200 kilometers east-west (Fig. 1-4). The two tectonic plates grinded past each other, causing one plate to slip under the other. A closer analysis revealed that the slippage began off the coast of Sendai, the largest city in the Tohoku region, and in some places, the slippage was more than 30 meters. You may have seen videos of high-rise buildings in Shinjuku, a major commercial and administrative center of Tokyo, swaying slowly on YouTube (7) and other sites, which was caused by long-period ground motions generated by the large earthquake. Seismographs also recorded these ground motions. The data of the earthquake collected by seismographs throughout Japan yielded very important insights, as few earthquakes of this magnitude had been observed before. Japan shared these data internationally to assist research on the mechanisms of large earthquakes and the motions of high-rise buildings during large earthquakes around the world. By making these valuable data globally accessible, Japan made a significant international contribution to research on reducing the damage caused by large earthquakes.

Fig. 1-4: The 2011 Tohoku earthquake was caused by the North American and Pacific plates grinding past each other at the place where they meet. The contour lines indicate slip amplitudes, and the numbers of the contour lines show the amounts of slippage. For example, contour line 4 is made by connecting the locations where 4-meter slippage was observed. The star shows the epicenter, the point where the slippage began. Large slip amplitudes were observed near this epicenter. The triangles show the locations of seismographs used for this analysis, out of those installed throughout Japan. This figure was modified from the result obtained by Japan Meteorological Agency and Meteorological Research Institute (8).
According to an ancient document in Japan, a huge tsunami reached the Pacific coast of Japan on January 26, 1700, but the source area of the earthquake that caused it was a mystery. To locate the source area, the Geological Survey of Japan, together with the University of Tokyo, conducted extensive research on the tsunami and earthquake using computer simulations, and discovered that the tsunami had been caused by an earthquake to the north of the west coast of America. This finding (9) was presented in a research paper in 1996. Because most American people were illiterate in those days, there was no written record about this earthquake in America, but thanks to modern research, the occurrence of a large earthquake on January 26, 1700 was added to American history. This is another international contribution made by Japan.
Sources and references
- Understanding plate motions (U.S. Geological Survey)
- Mechanism of earthquake occurrence (Japan Meteorological Agency) (in Japanese)
- Volcano in Japan (Geological Survey of Japan)
- Mechanism of earthquake occurence (Japan Meteorological Agency) (in Japanese)
- The 2011 off the Pacific Coast of Tohoku Earthquake (2011, Headquarters for Earthquake Research Promotion)
- Seismometers, seismographs, seismograms – what’s the difference? How do they work? (U.S. Geological Survey)
- SCIENCE CHANNEL, The long-period earthquake ground motion (2011, Japan Science and Technology Agency: JST)
- Slip distribution of the 2011 off the Pacific Coast of Tohoku Earthquake (2011, Japan Meteorological Agency and Meteorological Research Institute) (in Japanese)
- Satake, K., Shimazaki, K., Tsuji, Y. et al. Time and size of a giant earthquake in Cascadia inferred from Japanese tsunami records of January 1700. Nature 379, 246–249 (1996). https://doi.org/10.1038/379246a0